
XLGrapher - Creates XYZ Scatter PLots, Bubble Plots, Bar Charts, Contours, Gridded Surfaces and Solids in Excel
Deployed as an add-in for Microsoft Excel, ThreeDify XLGrapher makes 3D graphing and embedding as easy as highlighting a range of cells in a worksheet. With a few mouse clicks, you can easily create and embed within Microsoft Excel, a wide range of X-Y-Z scatter graphs, bubble plots, line graphs, 3D voxel and bar charts, Cartesian, polar and spherical plots, surfaces (TIN, 2.5D gridded surfaces or 3D surfaces) as well as water-tight solids. XLGrapher is totally integrated with Microsoft Excel and it runs completely within Microsoft Excel. The created 3D graphs and fitted equations are embedded as part of your Excel worksheets. That means there’s no need to run a separate application and there are no external files or additional file formats to manage. Further more, unlike all other 3D Excel Add-ins, the 3D objects saved in a workbook automatically appears in the containing worksheet(s) when opened next time.
Key Features
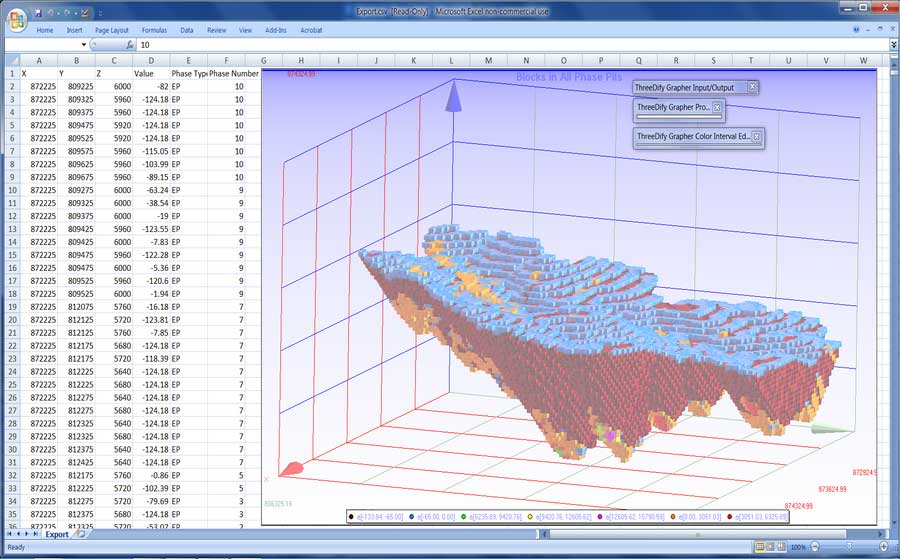
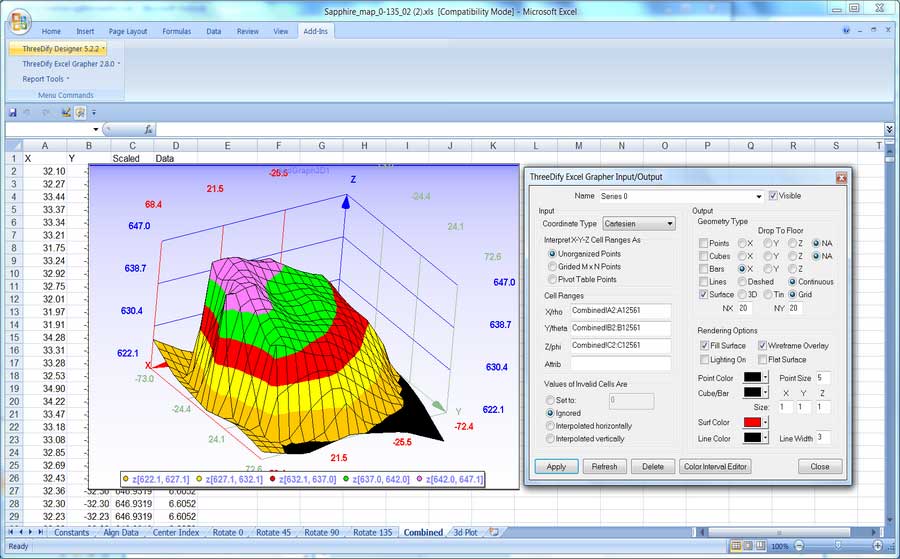
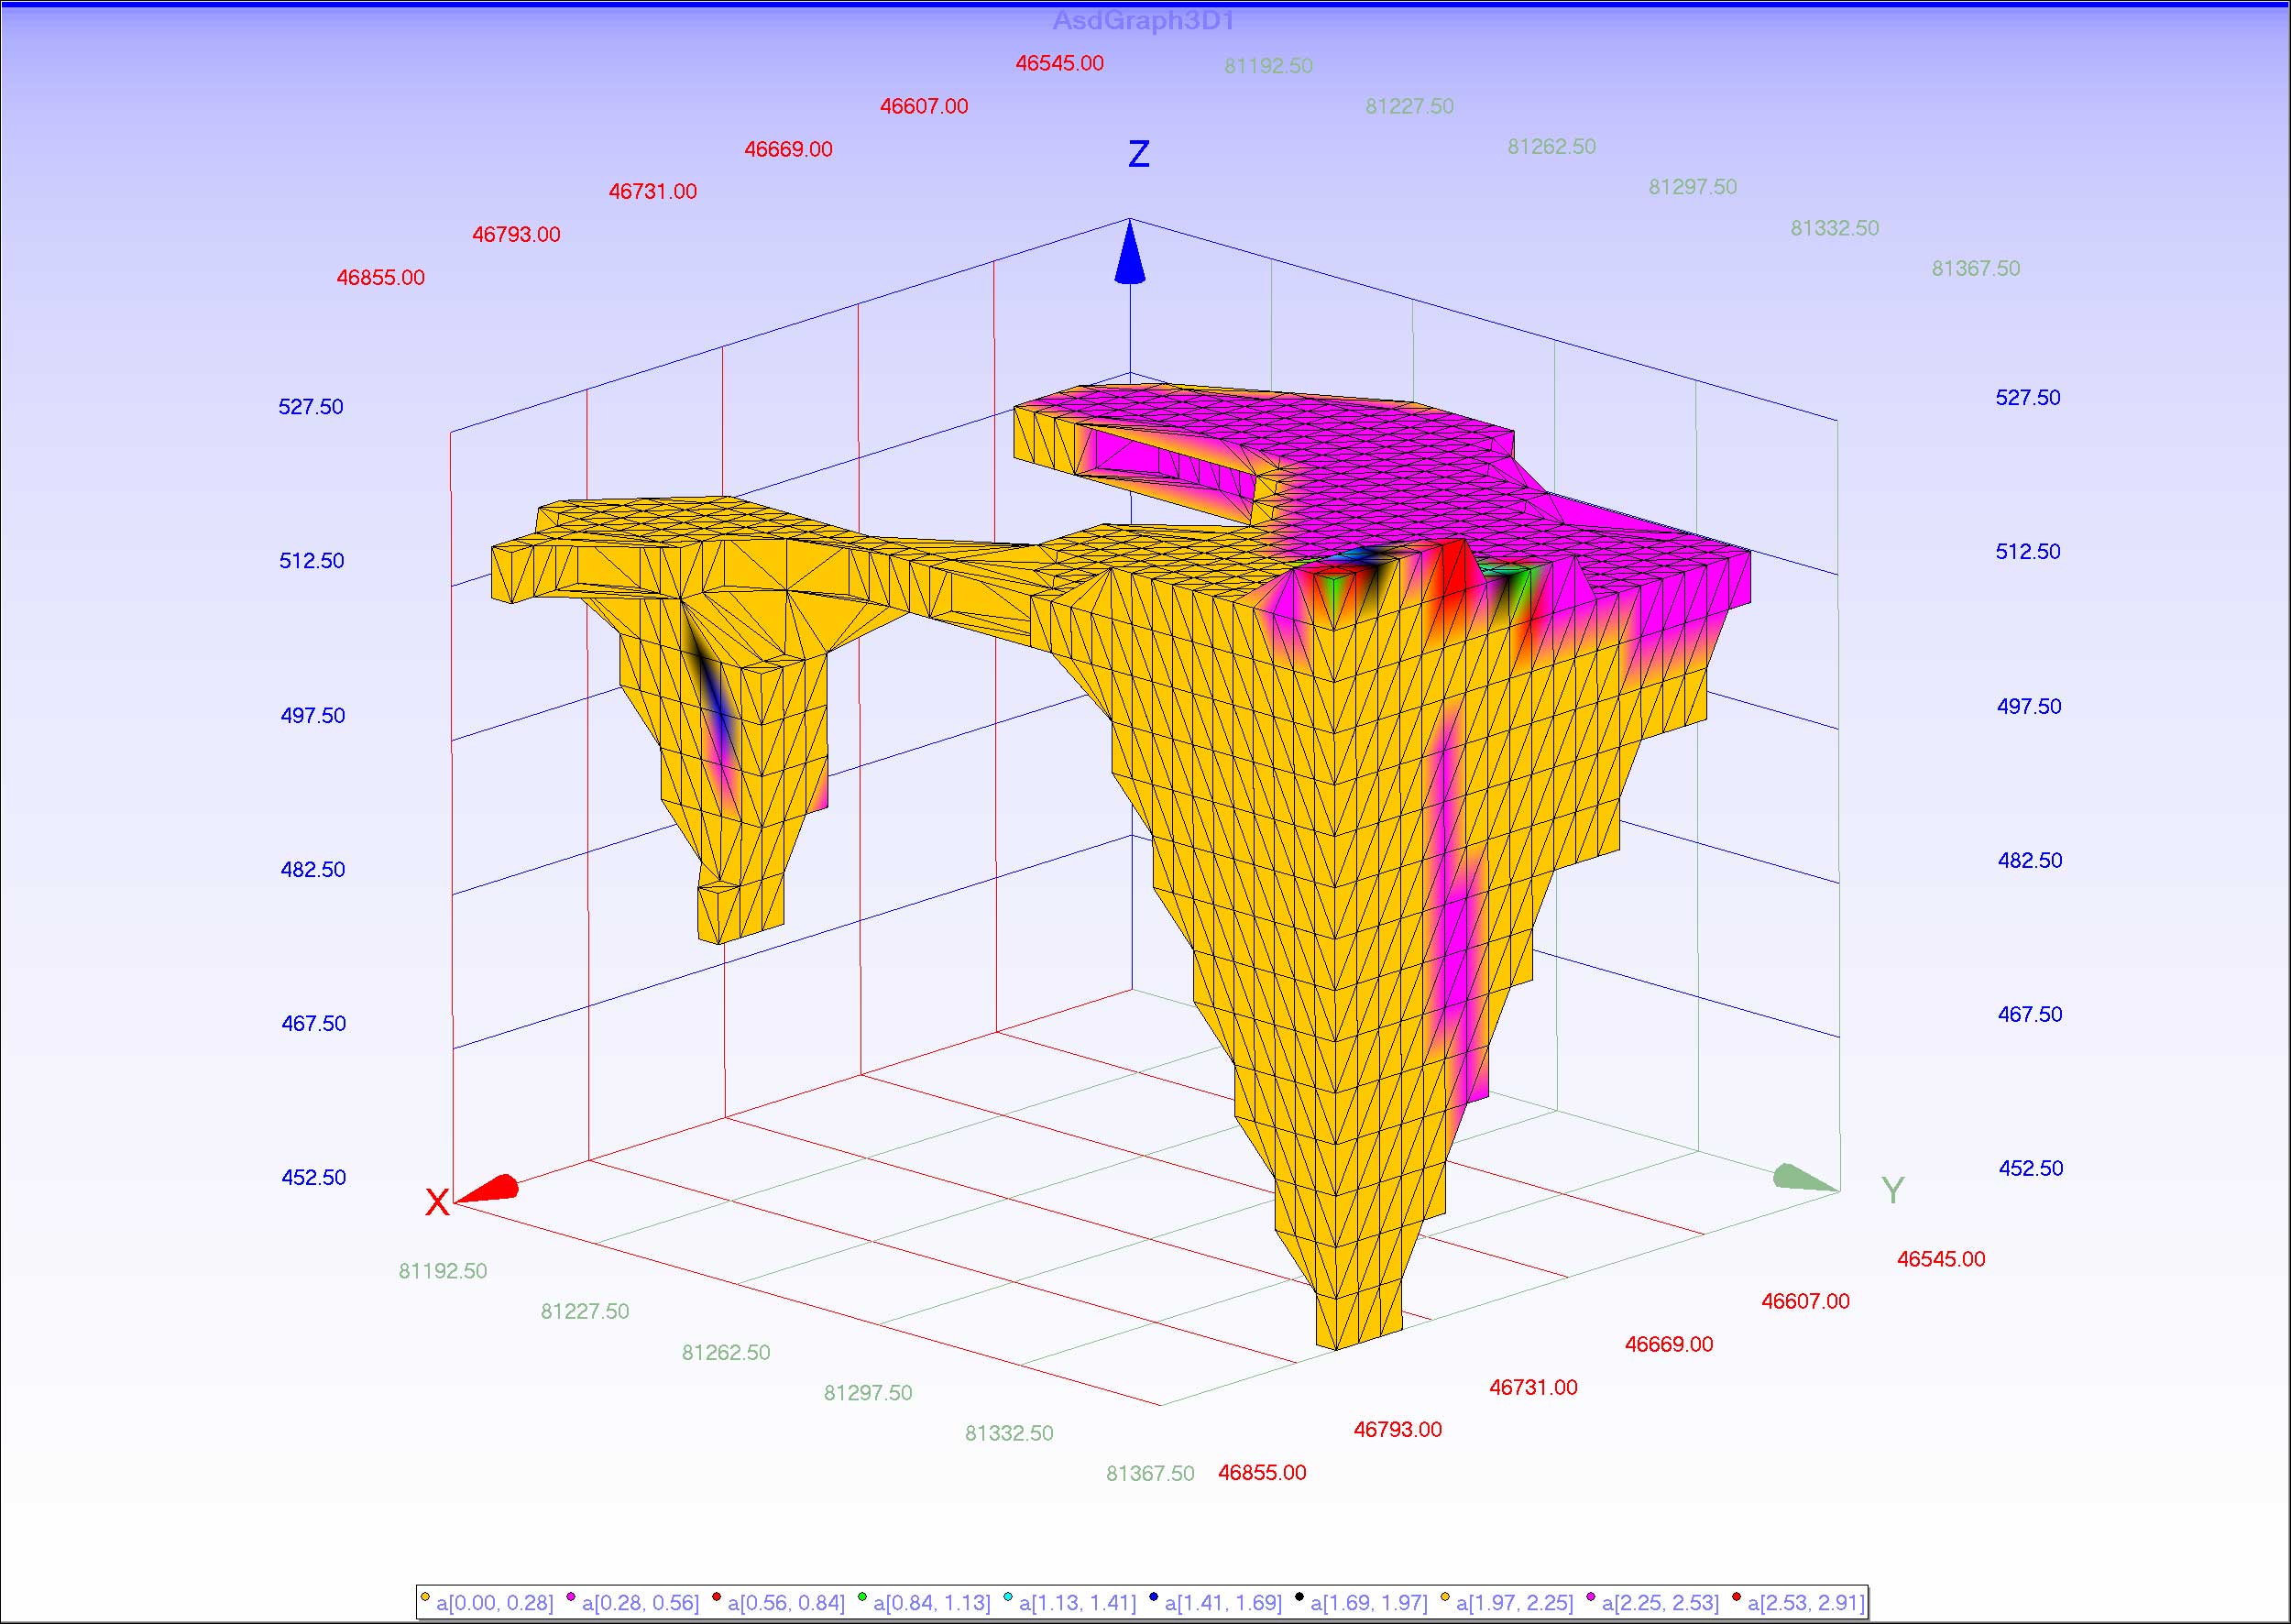
- Creates and embeds X-Y-Z scatter graphs, bubble plots, bar charts and CAD objects, such as line graphs, voxels, contours, 2.5D surfaces (TINs or gridded surfaces), 3D surface and water tight solids, directly from your worksheet cells;
- New in v6.0.x: Interpolates worksheet data to create gridded surfaces and exports the coordinate points of the gridded surfaces back to worksheets
- Exports high-resolution image or AVI videos;
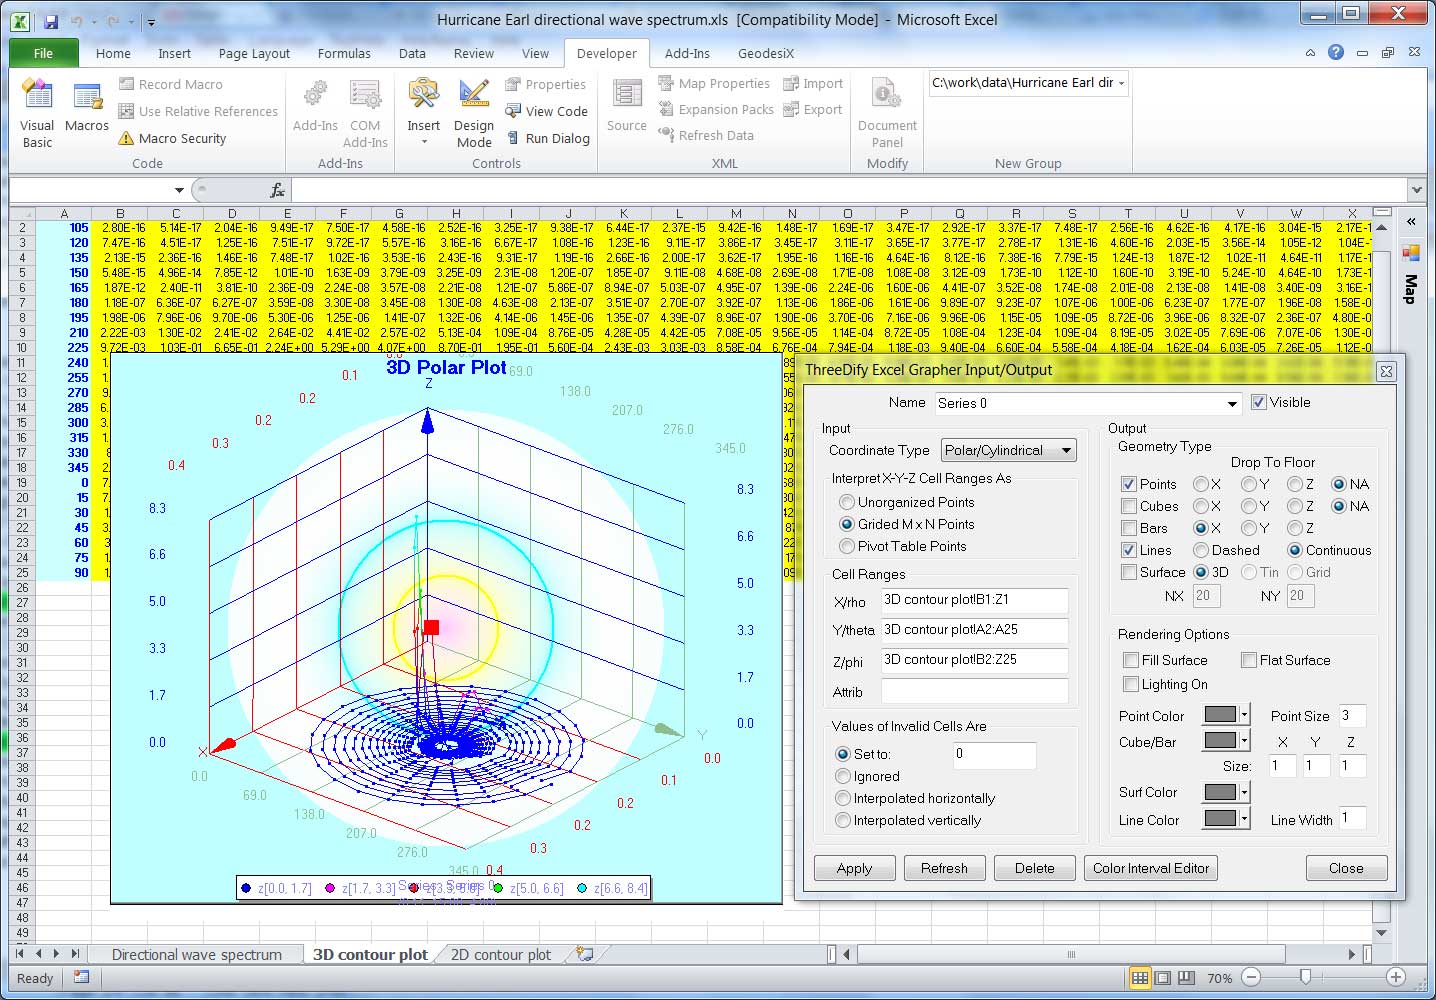
- Supports for 3D cartesian, polar(cylindrical) and spherical plots;
- Includes both uniform scaling (for presentation graphs) and non-uniform scaling (for engineering drawings) modes;
- Includes a wide variety of customization options for chart/graph display, including Wireframe Overlay , and Date/Time data type etc.
- Supports real-time graph updates on cell changes;
- Supports VBA scripting;
- Works with Excel 2000 and all later Excel Versions.
XLGrapher Feature List
Screenshots

System Requirements:
OS: Windows 7, 8.1, 10 or 11
Space: 30 MB
Additional Requirements: Microsoft Excel 2000 or better installed
Testimonials:

Plot multiple graph series inside Excel directly from user-specified cell ranges within MS Excel (when used as an Excel Addin only). The cell ranges can be specified from a single worksheet of the active workbook or from different worksheets in different open workbooks,allowing maximum flexibility in specifying input data for plotting.
Easily specify X, Y, Z cell ranges in MS Excel to plot with mouse or keyboard selection. The specified cell ranges do not have to be of the same dimension or size. They will be auto-resized.
Generation of TIN, gridded surfaces, and 3D surfaces or water-tight solids from unorganized points directly inside MS Excel.
Modifiable linear or radial color gradient background.
Animation export to AVI video formats.
Ability to Zoom, Pan (by middle mouse drag) and Spin (with an Arcball interface) and animate the graphs.
Support for different plot styles for each graph series: Bubbles (Spheres), Points, Lines, Voxels, Bars, TIN, Gridded Surfaces, 3D Surfaces, Solids or combination of several styles, as well as wireframe overlay and transparent mode.
Basic 4D data visualization directly within Excel.
Support for numerical and date/time data types.
Support 3D Cartesian, Polar(Cylindrical) and Spherical plots in both uniform scaling (for presentation graphs) and non-uniform scaling (for engineering drawing) modes.
Supports the CAD drawing mode that respects input data’s aspect ratio as well as the Presentation mode that scales the graphs
Flexible data scaling option for both presentation graphs and engineering drawings.
Axis customization, including customizable grid spacing, font, colors, and axis labels.
Ability to export surfaces and/or solids to DXF or VRML v2 format.
Real-time graph update on cell change.
Export to image files of user-specified size and format: *.bmp, *.exr, *.gif, *.hdr, *.ico, *.jpg, *.jpg2, *.jpc, *jpeg, *.pfm, *.png, *.pbm, *.pgm, *ppm, *.tga, *.tif, *.xpm.
Automation through VB and VBA.